
Where House Prices in San Diego Stand Right Now
House prices in San Diego continue to climb, though the pace has slowed. The median single-family home in San Diego County sold for $1,089,795 in February 2026, a 2.1% increase over the same month last year, according to the Greater San Diego Association of REALTORS (SDAR). The average sale price was $1,406,108.
The condo and townhome market tells a different story. Attached homes posted a median of $660,000, down 2.2% year over year. That split matters if you are deciding when to sell: single-family sellers still have pricing momentum, while condo sellers face a softer market.
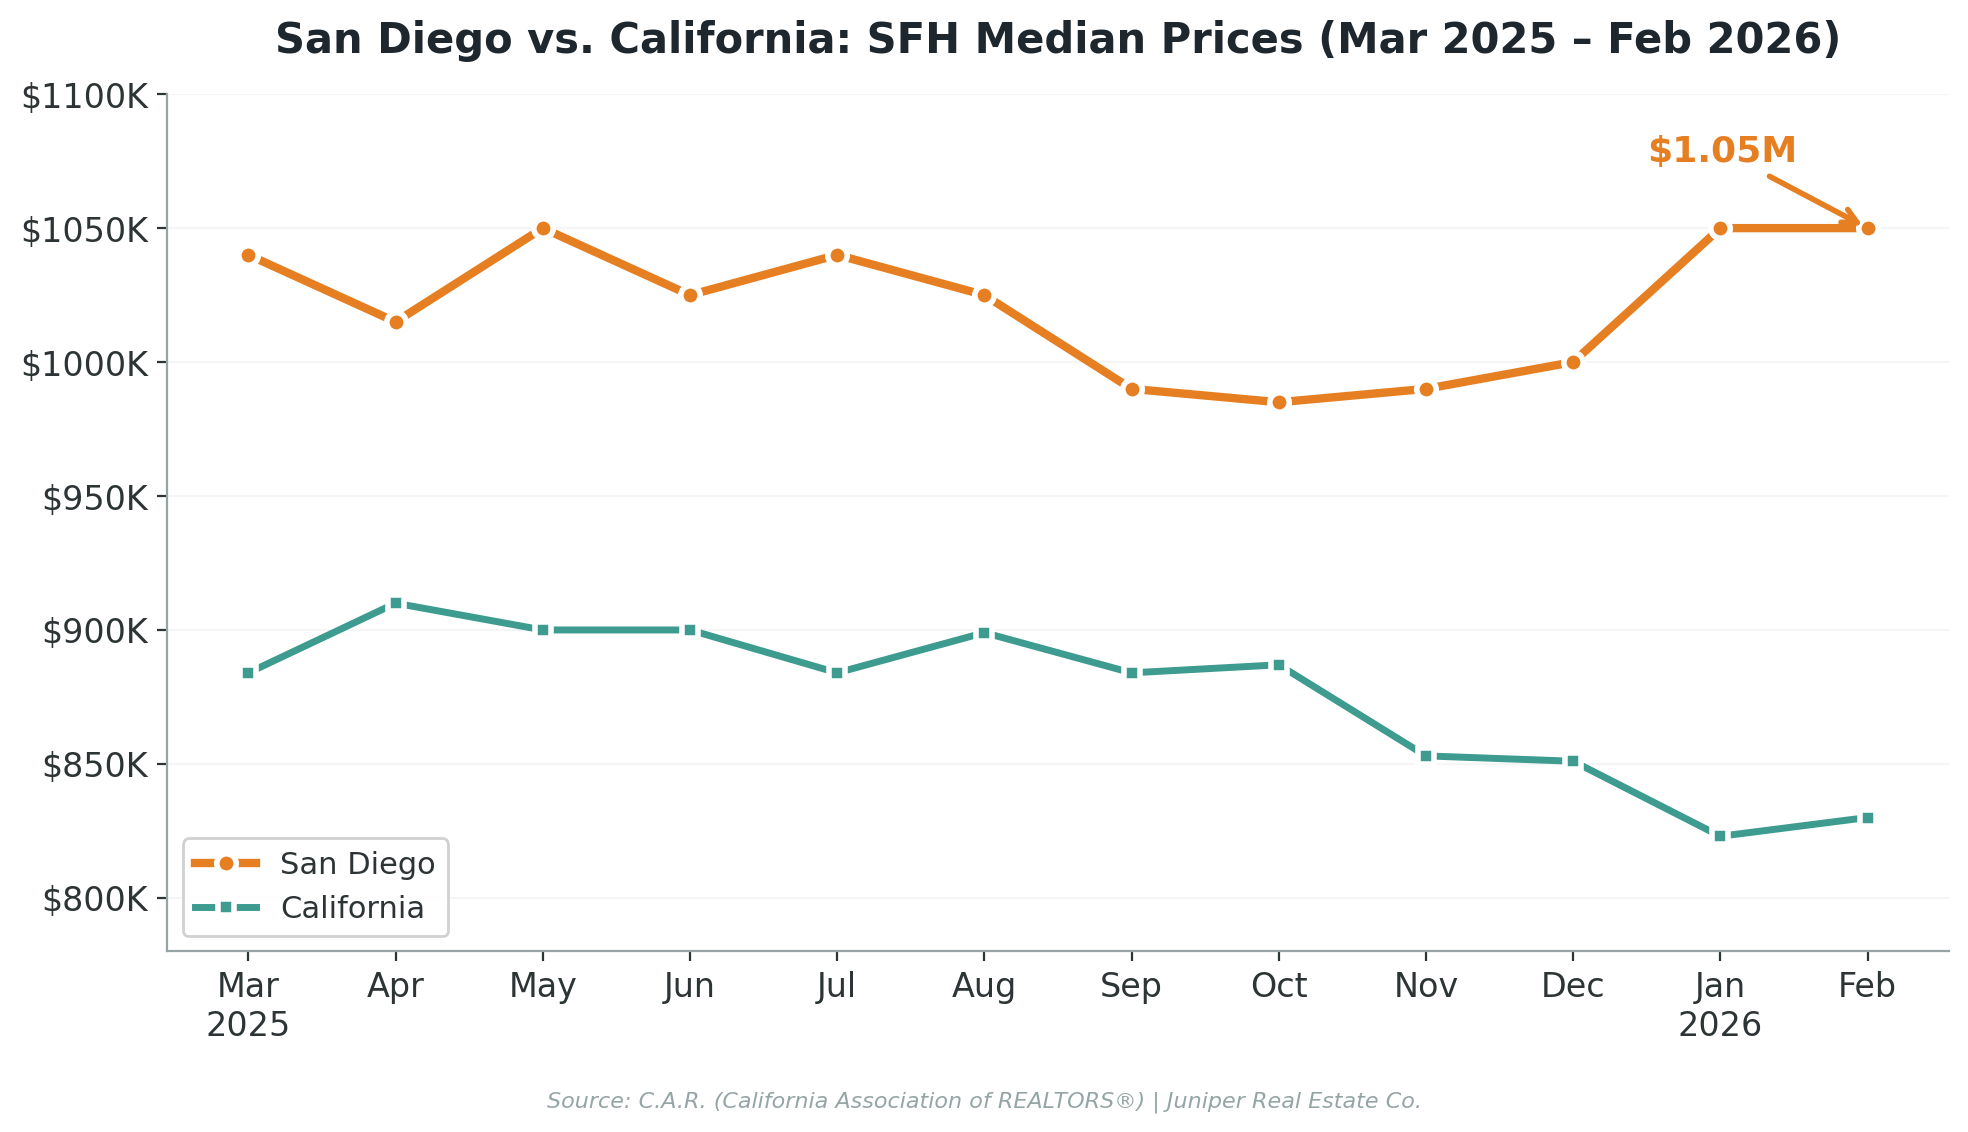
San Diego has consistently traded above the California statewide median over the past 12 months. While the state saw prices dip from $910,000 in April to $830,000 by February, San Diego held steady between $985,000 and $1,050,000. The floor appears to be around a million dollars for single-family homes, and the most recent two months both landed at $1,050,000.
The Supply Picture Favors Sellers
Inventory is the number to watch. There are 2,379 single-family homes for sale in San Diego County right now, down 19.1% from a year ago. That translates to 1.9 months of supply at the current sales pace. Anything under 2.0 months is a strong seller’s market, and San Diego has been there for most of the past year.
Attached inventory is slightly looser at 1,841 units and 2.8 months of supply, but still below the 4-month threshold that would indicate a balanced market.
New listings are also down 17.6% for detached homes and 21.6% for attached. Fewer sellers listing means less competition for those who do. Pending sales, meanwhile, ticked up 0.3% for detached homes, signaling that buyer demand has not disappeared even with rates above 6.5%.
The Neighborhood Seller’s Scorecard
County-wide averages are useful, but your home does not sell in the county. It sells in a neighborhood. The table below ranks San Diego neighborhoods by seller favorability using five key metrics from the San Diego MLS (February 2026 data).
| Neighborhood | SFH Median | YoY Change | DOM | % List Price | Months Supply |
|---|---|---|---|---|---|
| University City | $1,725,000 | +7.1% | 9 | 103.5% | 1.2 |
| North Park | $1,125,000 | -4.9% | 30 | 104.4% | 2.0 |
| Allied Gardens, Del Cerro | $1,150,000 | +4.5% | 58 | 97.3% | 0.9 |
| Clairemont | $1,143,000 | -4.6% | 24 | 98.6% | 1.2 |
| College Area | $1,030,000 | -1.9% | 46 | 95.0% | 1.0 |
| Hillcrest, Mission Hills | $1,751,000 | +7.4% | 38 | 99.7% | 2.2 |
| Kensington, Normal Heights | $1,555,000 | +6.3% | 43 | 99.2% | 1.8 |
| Point Loma | $1,783,000 | -8.0% | 38 | 95.7% | 2.3 |
| La Jolla | $3,545,000 | -11.0% | 65 | 94.4% | 3.8 |
| Pacific Beach | $2,331,000 | +13.8% | 41 | 96.3% | 2.5 |
Swipe to see all columns →
Reading the scorecard: DOM under 30 means properties are moving fast. Percent of list price above 100% means sellers are getting over asking. Months supply under 2.0 is a strong seller’s market.
Hottest for sellers: University City sellers averaged 103.5% of list price with only 9 days on market and 1.2 months of supply. North Park hit 104.4% of list price. Allied Gardens/Del Cerro had just 0.9 months of supply, the tightest in the county. If you own in these neighborhoods, the market is working in your favor.
Softening for sellers: La Jolla single-family prices are down 11% year over year with 3.8 months of supply and 65 days on market. Point Loma is down 8%. The luxury end of the market is seeing more price negotiation and longer timelines. This does not mean it is a bad time to sell in these areas; it means pricing strategy matters more than it did a year ago.
5 Signs the San Diego Market Favors Sellers in 2026
1. Inventory dropped 19.1% year over year. Fewer homes on the market means less competition. There are 561 fewer single-family homes for sale than last February.
2. Months supply is 1.9 for detached homes. Anything under 2.0 is textbook seller’s territory. At the current pace, every home listed today would sell within two months.
3. Median prices are still rising. The county-wide median climbed 2.1% year over year to $1,089,795. Not a boom, but prices have not retreated despite elevated mortgage rates.
4. Multiple neighborhoods are selling above asking. University City (103.5%), North Park (104.4%), and several other neighborhoods are commanding prices above original list. In a balanced or buyer’s market, that does not happen.
5. New listings are down 17.6%. Fewer sellers are entering the market. If you list now, you face less competition from other sellers than at almost any point in the past two years.
When Selling Might Not Make Sense
Honest assessment: selling is not the right move for everyone, even in a strong market.
If you would be buying back into the same market, the math can cancel out. You sell high, but you also buy high. Unless you are downsizing, relocating to a lower-cost area, or have another property to move into, the transaction costs (typically 6-8% between commissions, closing costs, and moving expenses) can eat into your gains.
If you are in a softening submarket, pricing needs to be realistic from day one. La Jolla, Point Loma, and Pacific Beach condos have all seen price declines. Sellers in these areas who price based on 2024 comps, rather than current 2026 data, end up sitting longer and chasing the market down.
If your mortgage rate is under 4%, you have a financial asset that is hard to replicate. Many San Diego homeowners locked in rates between 2.5% and 3.5% during 2020-2021. Giving up a 3% rate to buy at 6.5%+ changes the monthly math dramatically. Run the numbers before assuming a sale makes sense.
What This Means for You
If You Are Thinking About Listing
Your neighborhood data matters more than the county headline. A home in Clairemont with 1.2 months of supply and 24 days on market is in a fundamentally different position than a home in La Jolla with 3.8 months and 65 days. Get a comparative market analysis (CMA) that uses current MLS data for your specific neighborhood. Zestimates are estimates; CMA data from the San Diego MLS is what your buyer’s agent will reference when writing an offer.
If You Are an Investor Evaluating an Exit
Properties in neighborhoods with under 2.0 months of supply and rising prices are in the strongest sell position. Properties in neighborhoods with 3.0+ months of supply may benefit from holding, especially if they generate rental income. Juniper’s property management services can keep a property performing while you wait for a better window. For properties you do plan to sell, a professional appraisal can clarify where you stand.
How to Get a Realistic Price for Your San Diego Home
Online estimates from Zillow, Redfin, and Realtor.com use automated models that struggle with San Diego’s neighborhood-level variation. A Zestimate for a home in Hillcrest cannot account for whether the home is on a quiet side street or a busy corridor, whether it has a permitted ADU, or whether recent sales in the immediate area were fixers or fully renovated.
A CMA from a local agent pulls the actual MLS data: what has sold within a quarter mile in the last 90 days, what is pending, and what is sitting. That is how buyers and their agents will evaluate your home, so it is how you should evaluate it too.
Miguel has been running CMAs and advising San Diego sellers for over 20 years. If you want an honest read on what your home is worth in today’s market, based on real MLS data, not an algorithm, reach out anytime: 619.253.3333 or miguel(at)junipersdre(dotted)com.
Data sources: Greater San Diego Association of REALTORS (SDAR) Monthly Indicators and FastStats, February 2026; C.A.R. median price data, March 2025 through February 2026. All MLS data current as of March 5, 2026.