San Diego’s housing market tightened hard this spring. The county’s single-family median hit $1,100,000 in March 2026, a 12-month high, while the number of homes available to buy fell by more than a fifth compared to last year. More buyers chasing fewer listings, and sellers collecting nearly full asking price. That’s the headline. The neighborhood-level story is more complicated.
In some parts of the county, homes are selling in under two weeks with barely any inventory left on the shelf. In others, properties are sitting for 48 days and buyers have real negotiating room. The gap between the tightest and loosest markets in San Diego right now is wider than it’s been in years, and the county median doesn’t capture any of that.
This report breaks down what actually happened in March 2026 across 17 San Diego neighborhoods, using closed transaction data from the Greater San Diego Association of REALTORS® FastStats reports, current as of April 5, 2026. No estimates, no projections, just what sold, for how much, and how long it took.
March 2026 County Snapshot
Single-family homes and condos are telling two different stories right now. The SFH market tightened considerably compared to last year. The condo market went the other direction, with more inventory and prices down slightly. The table below covers both.
| Metric | Mar 2025 | Mar 2026 | YoY |
|---|---|---|---|
| SINGLE-FAMILY HOMES | |||
| Median Sale Price | $1,074,250 | $1,100,000 | +2.4% |
| Closed Sales | 1,156 | 1,216 | +5.2% |
| New Listings | 2,139 | 1,833 | -14.3% |
| Days on Market | 34 | 37 | +8.8% |
| Active Inventory | 3,200 | 2,513 | -21.5% |
| Months Supply | 2.6 | 2.0 | -23.1% |
| Pct. of List Price Received | 98.7% | 98.9% | +0.2% |
| CONDOS & TOWNHOMES | |||
| Median Sale Price | $677,450 | $670,000 | -1.1% |
| Closed Sales | 673 | 738 | +9.7% |
| Days on Market | 40 | 45 | +12.5% |
| Active Inventory | 2,296 | 2,369 | +3.2% |
| Months Supply | 3.3 | 3.4 | +3.0% |
Source: SDAR Monthly Market Indicators, March 2026, current as of April 5, 2026.
Sellers received 98.9% of list price on average for single-family homes, essentially full ask. That number has barely budged in six months. On the condo side, buyers have more room to negotiate, roughly 3.4 months of supply across the county versus 2.0 months for houses.
The Price Trend: A Fall Dip, Then a Recovery
The chart below plots the county’s SFH median sale price month by month from April 2025 through March 2026. Data is from SDAR’s Monthly Market Indicators report.
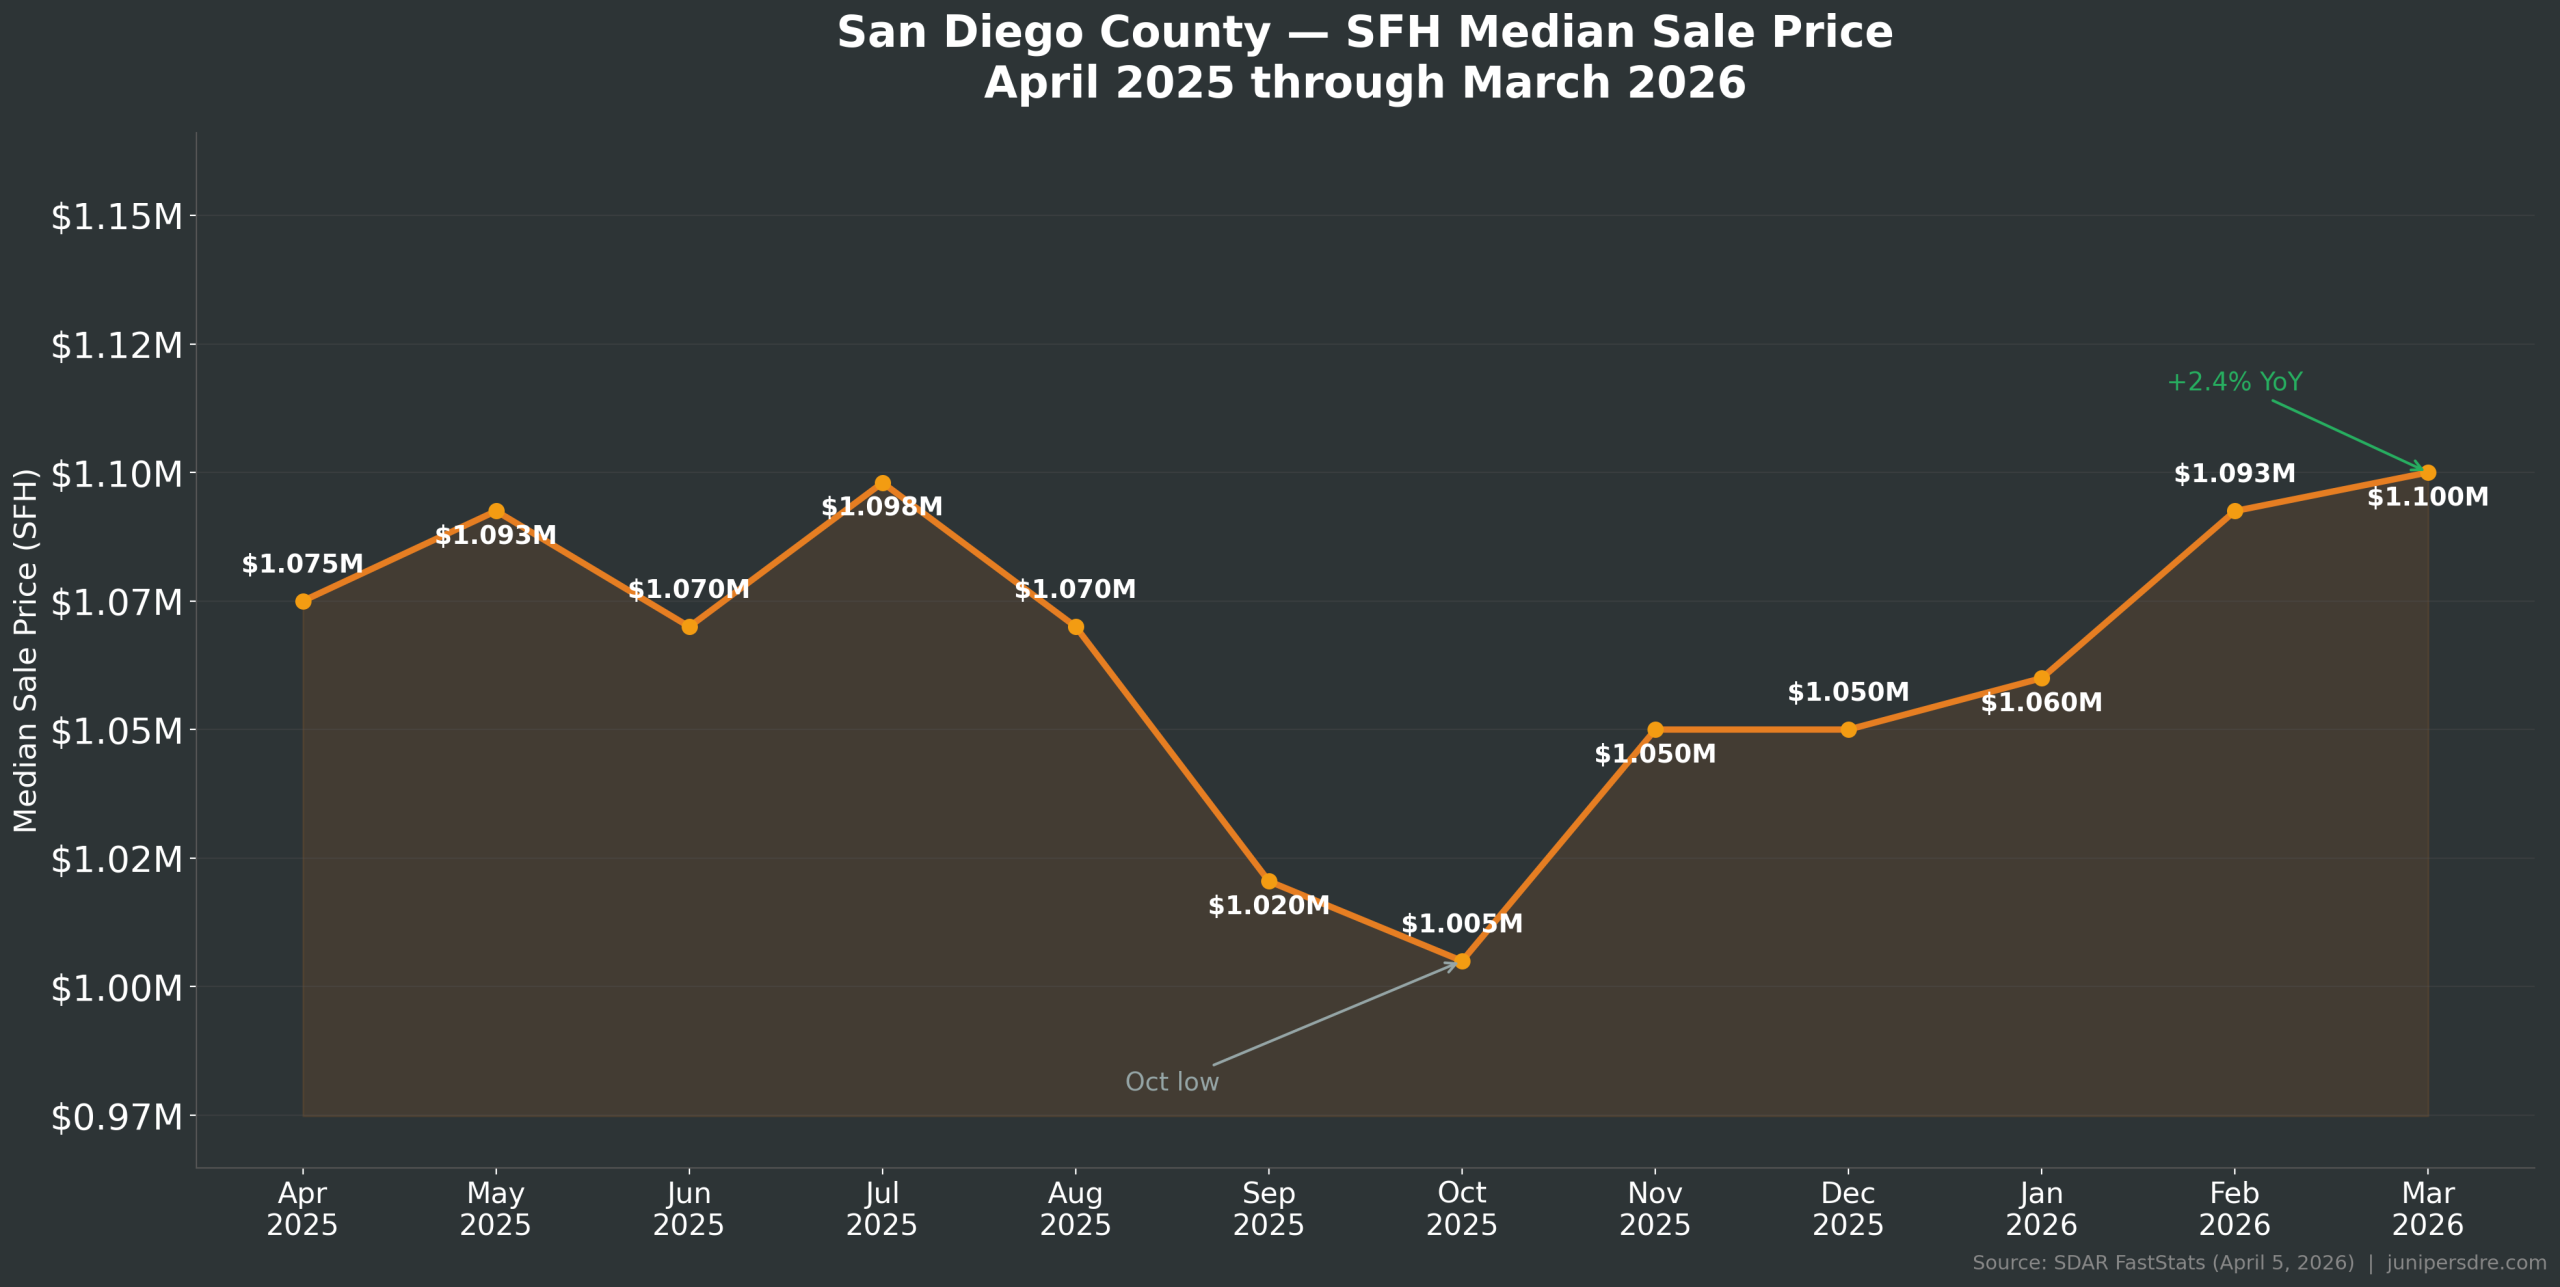
Prices peaked around $1.075-1.098M in spring and early summer 2025, then fell to $1,005,000 in October, the lowest point in the trailing year. From there, they recovered steadily through the winter and closed March at $1,100,000, a new 12-month high. That’s a roughly 9% drop and full recovery in about six months, which is a shallower cycle than some years.
The recovery isn’t surprising given how little inventory is available. When fewer homes hit the market, prices have less room to fall. The 21.5% drop in SFH inventory since last March is what’s holding prices up.
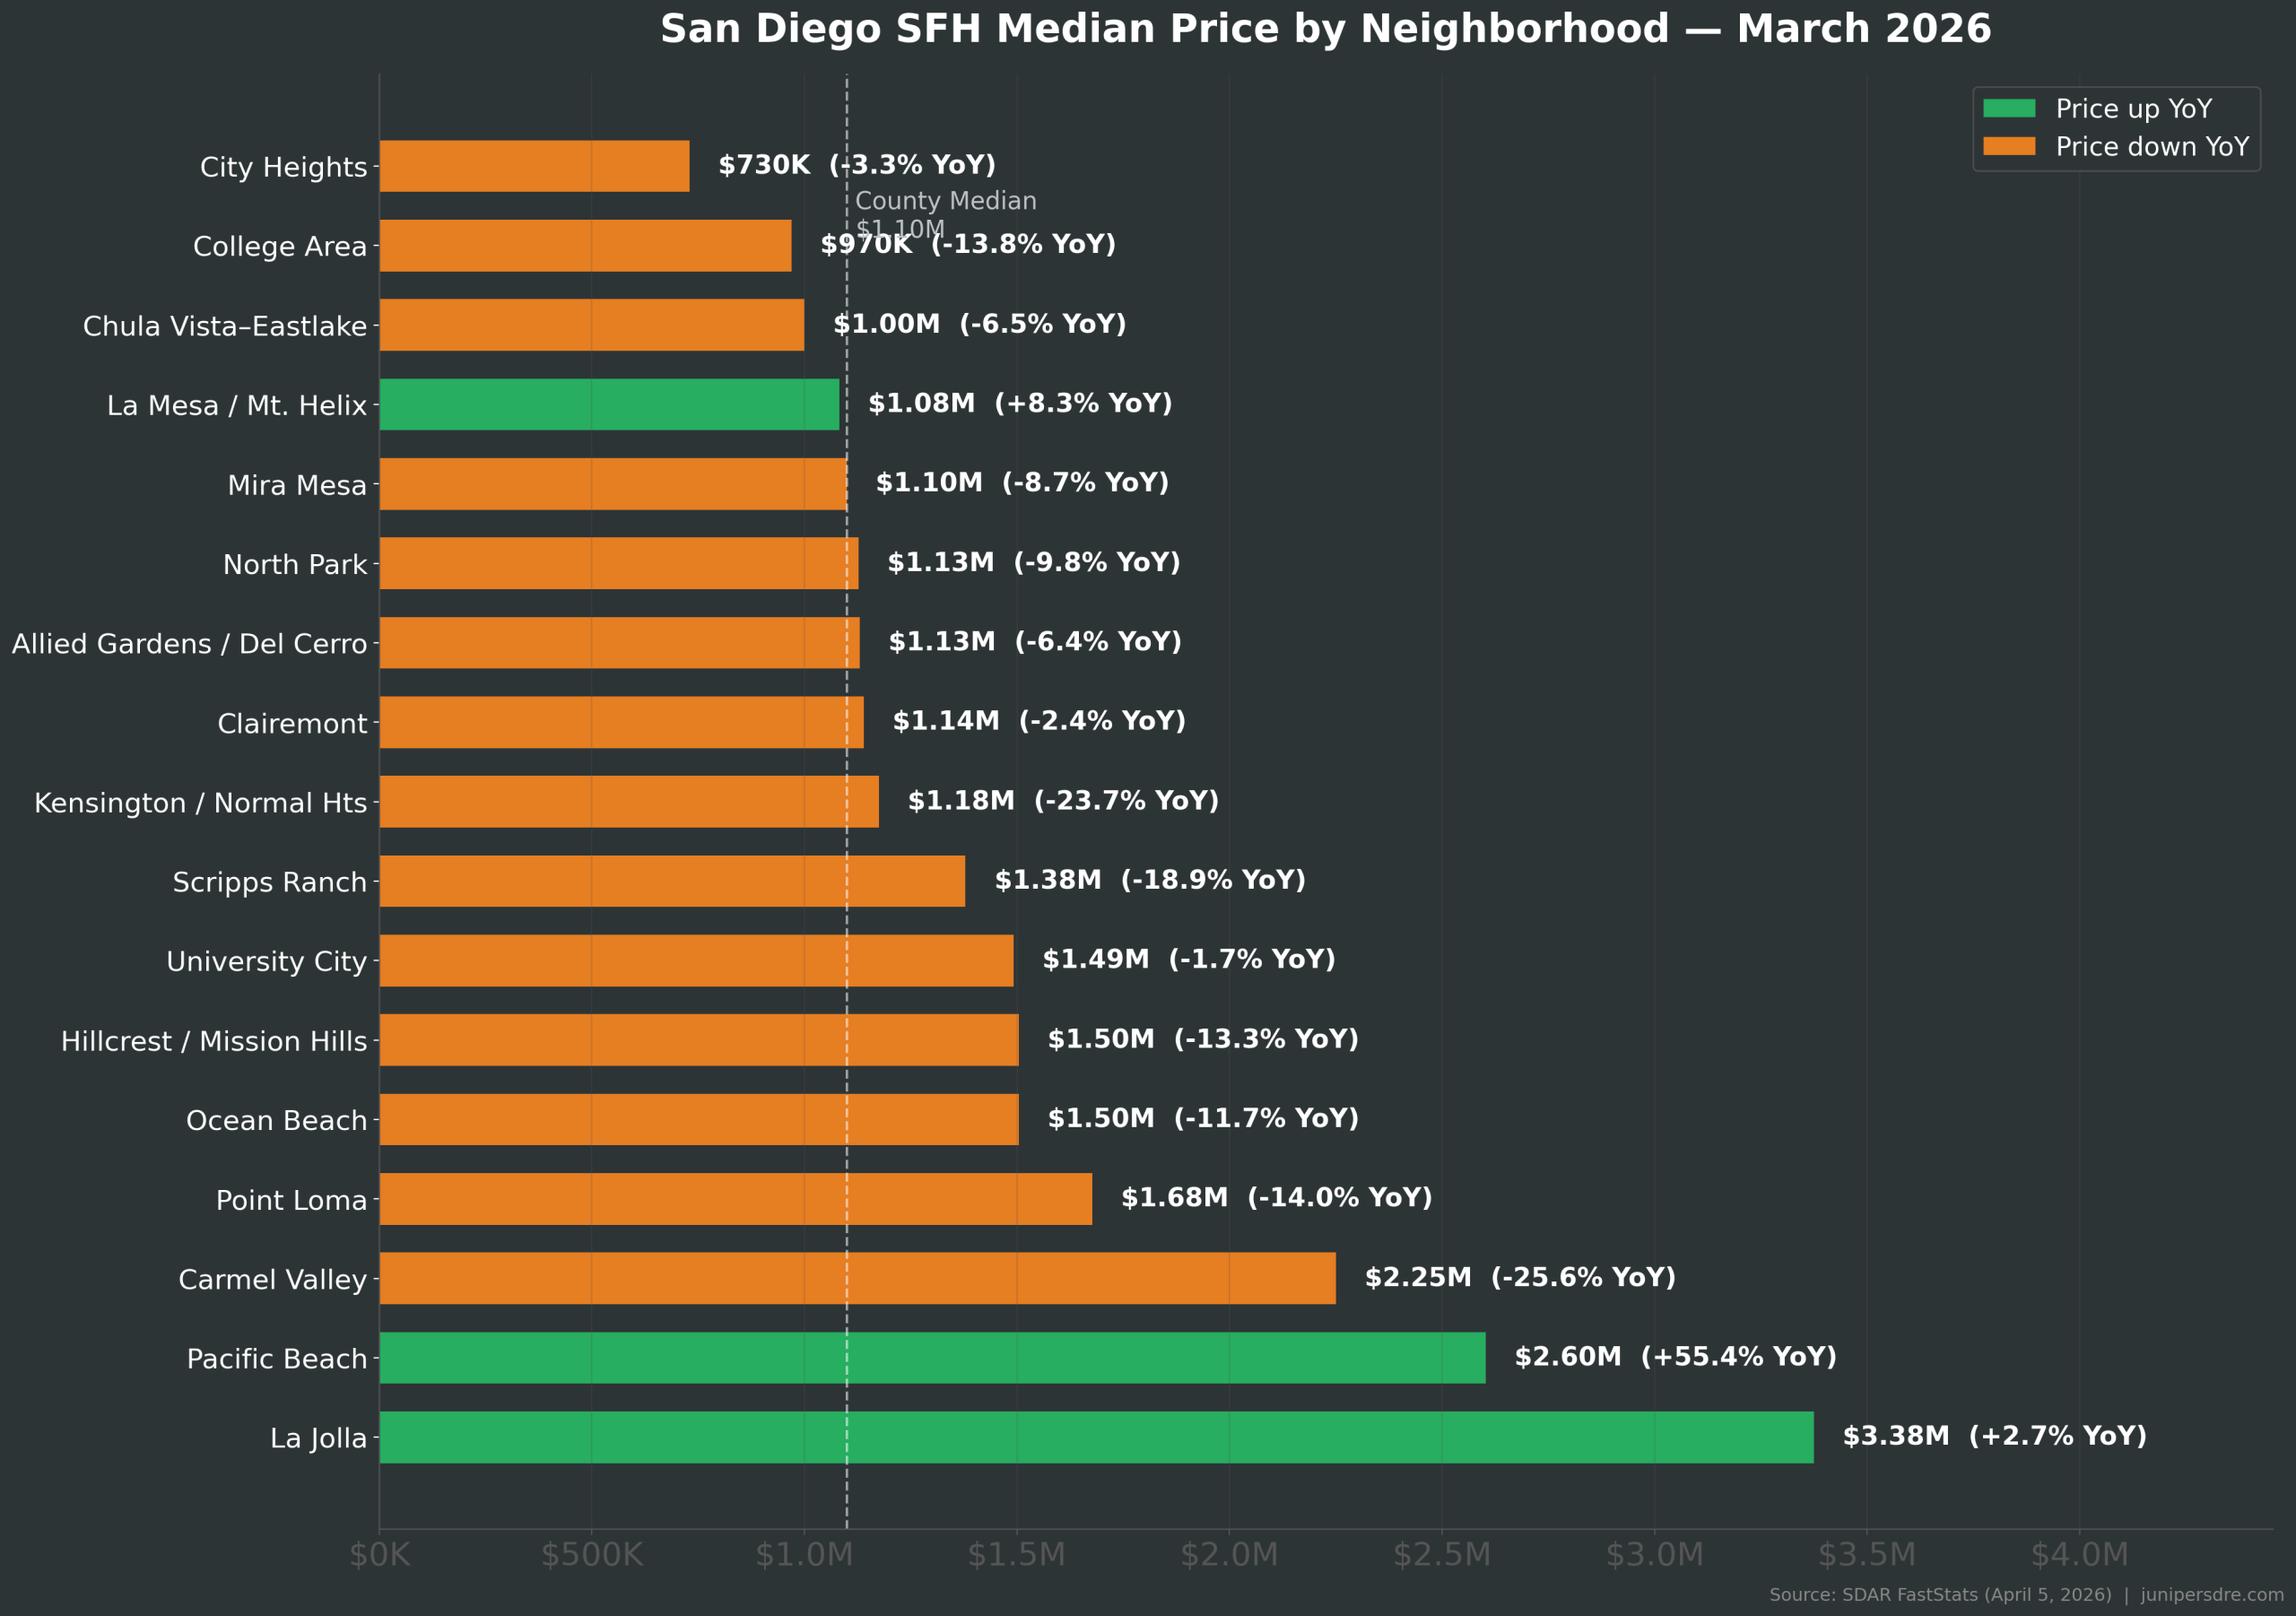
San Diego Neighborhood Home Prices, March 2026
County-wide numbers hide a lot. A single-family home in City Heights sold for a median of $730,000 in March. In La Jolla, the median was $3,375,000. Every neighborhood in the table below is pulled from actual MLS closed transactions, sourced from SDAR FastStats.
One note on reading the single-month data: neighborhoods with fewer than 15 closings in a given month can have volatile medians. For those (marked *), look at the YTD column instead, which pools January through March and gives a more reliable picture.
| Neighborhood | Mar 2026 Median | YoY % | YTD Median | YTD YoY % | DOM | Supply | Inventory |
|---|---|---|---|---|---|---|---|
| City Heights | $730K | -3.3% | $720K | -4.6% | 31 | 1.8 | 20 |
| College Area | $970K | -13.8% | $995K | -9.5% | 24 | 1.7 | 34 |
| Chula Vista – Eastlake | $1.00M | -6.5% | $983K | -10.6% | 19 | 1.8 | 36 |
| La Mesa / Mt. Helix | $1.083M | +8.3% | $1.125M | +23.0% | 31 | 1.8 | 39 |
| Mira Mesa | $1.10M | -8.7% | $1.115M | -3.5% | 30 | 1.3 | 25 |
| North Park | $1.128M | -9.8% | $1.120M | -8.8% | 48 | 1.8 | 21 |
| Allied Gardens / Del Cerro | $1.130M | -6.4% | $1.135M | -1.3% | 29 | 0.7 | 13 |
| Clairemont | $1.140M | -2.4% | $1.143M | -4.6% | 29 | 0.9 | 25 |
| Kensington / Normal Heights | $1.175M* | -23.7%* | $1.528M | +3.6% | 25 | 2.5 | 28 |
| Scripps Ranch | $1.379M* | -18.9%* | $1.543M | -8.5% | 20 | 1.7 | 22 |
| University City | $1.493M | -1.7% | $1.650M | +2.6% | 23 | 1.3 | 12 |
| Hillcrest / Mission Hills | $1.505M | -13.3% | $1.621M | -0.5% | 21 | 2.6 | 32 |
| Ocean Beach | $1.505M | -11.7% | $1.868M | -6.0% | 25 | 1.9 | 20 |
| Point Loma | $1.677M | -14.0% | $1.775M | -9.0% | 15 | 2.4 | 29 |
| Carmel Valley | $2.250M* | -25.6%* | $2.701M | -0.9% | 13 | 1.7 | 28 |
| Pacific Beach | $2.603M* | +55.4%* | $2.350M | +23.6% | 45 | 2.6 | 31 |
| La Jolla | $3.375M | +2.7% | $3.500M | -1.1% | 48 | 3.6 | 83 |
SFH only. DOM = days on market until sale. Supply = months supply of inventory. *Single-month median based on fewer than 15 closings. YTD = Jan–Mar 2026. Source: SDAR FastStats, April 5, 2026.
Where Homes Are Moving Fastest
Point Loma led the county in March with a median of 15 days on market for single-family homes, well under the county average of 37. Carmel Valley came in at 13 days. Chula Vista–Eastlake hit 19 days despite having the lowest price point of the coastal-adjacent markets.
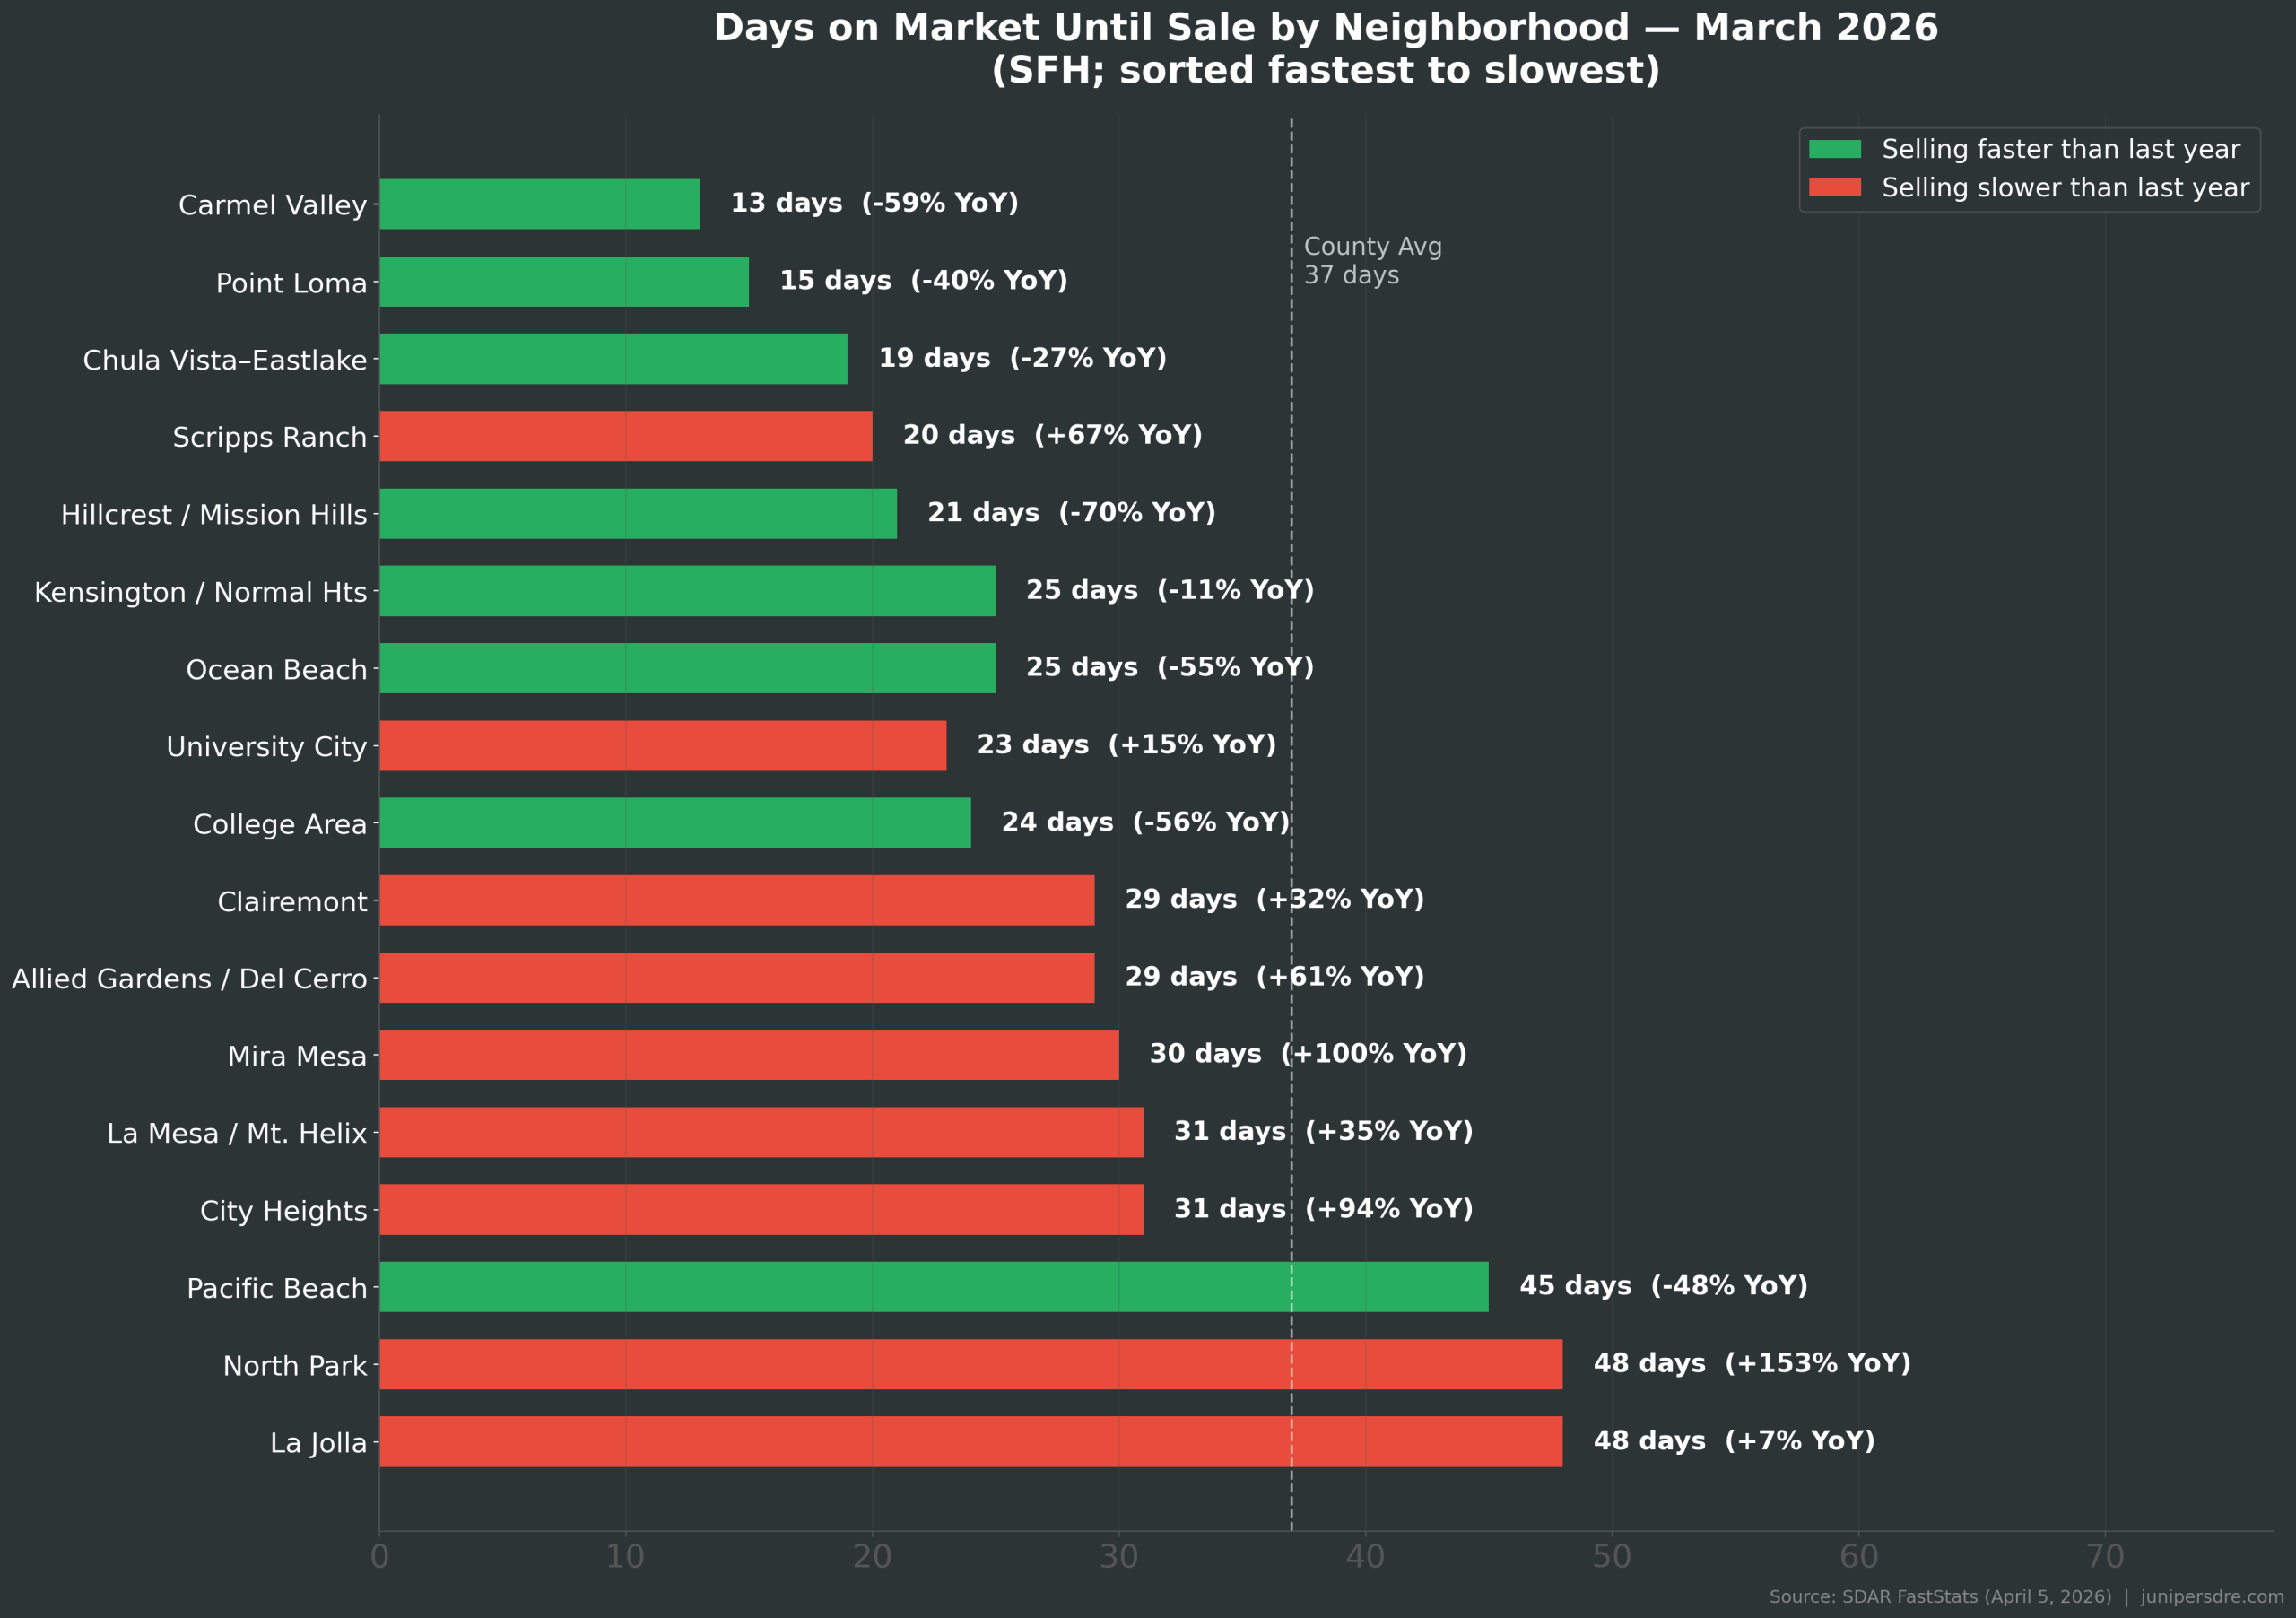
North Park had a 48-day median in March, compared to 19 days a year ago. That’s a 152% increase year-over-year. More listings, more buyer caution, or both, but either way North Park has slowed considerably from the frenzied pace it ran in early 2025. La Jolla also came in at 48 days, which is pretty typical for a luxury market where buyers take their time.
Inventory by Neighborhood: Where You Have Leverage
Months supply of inventory tells you how long it would take to sell all current listings at the current sales pace. Under 2.0 months is generally considered a seller’s market. Allied Gardens/Del Cerro had just 0.7 months in March, the tightest reading in the county. Clairemont was at 0.9. These aren’t markets where lowball offers go anywhere.
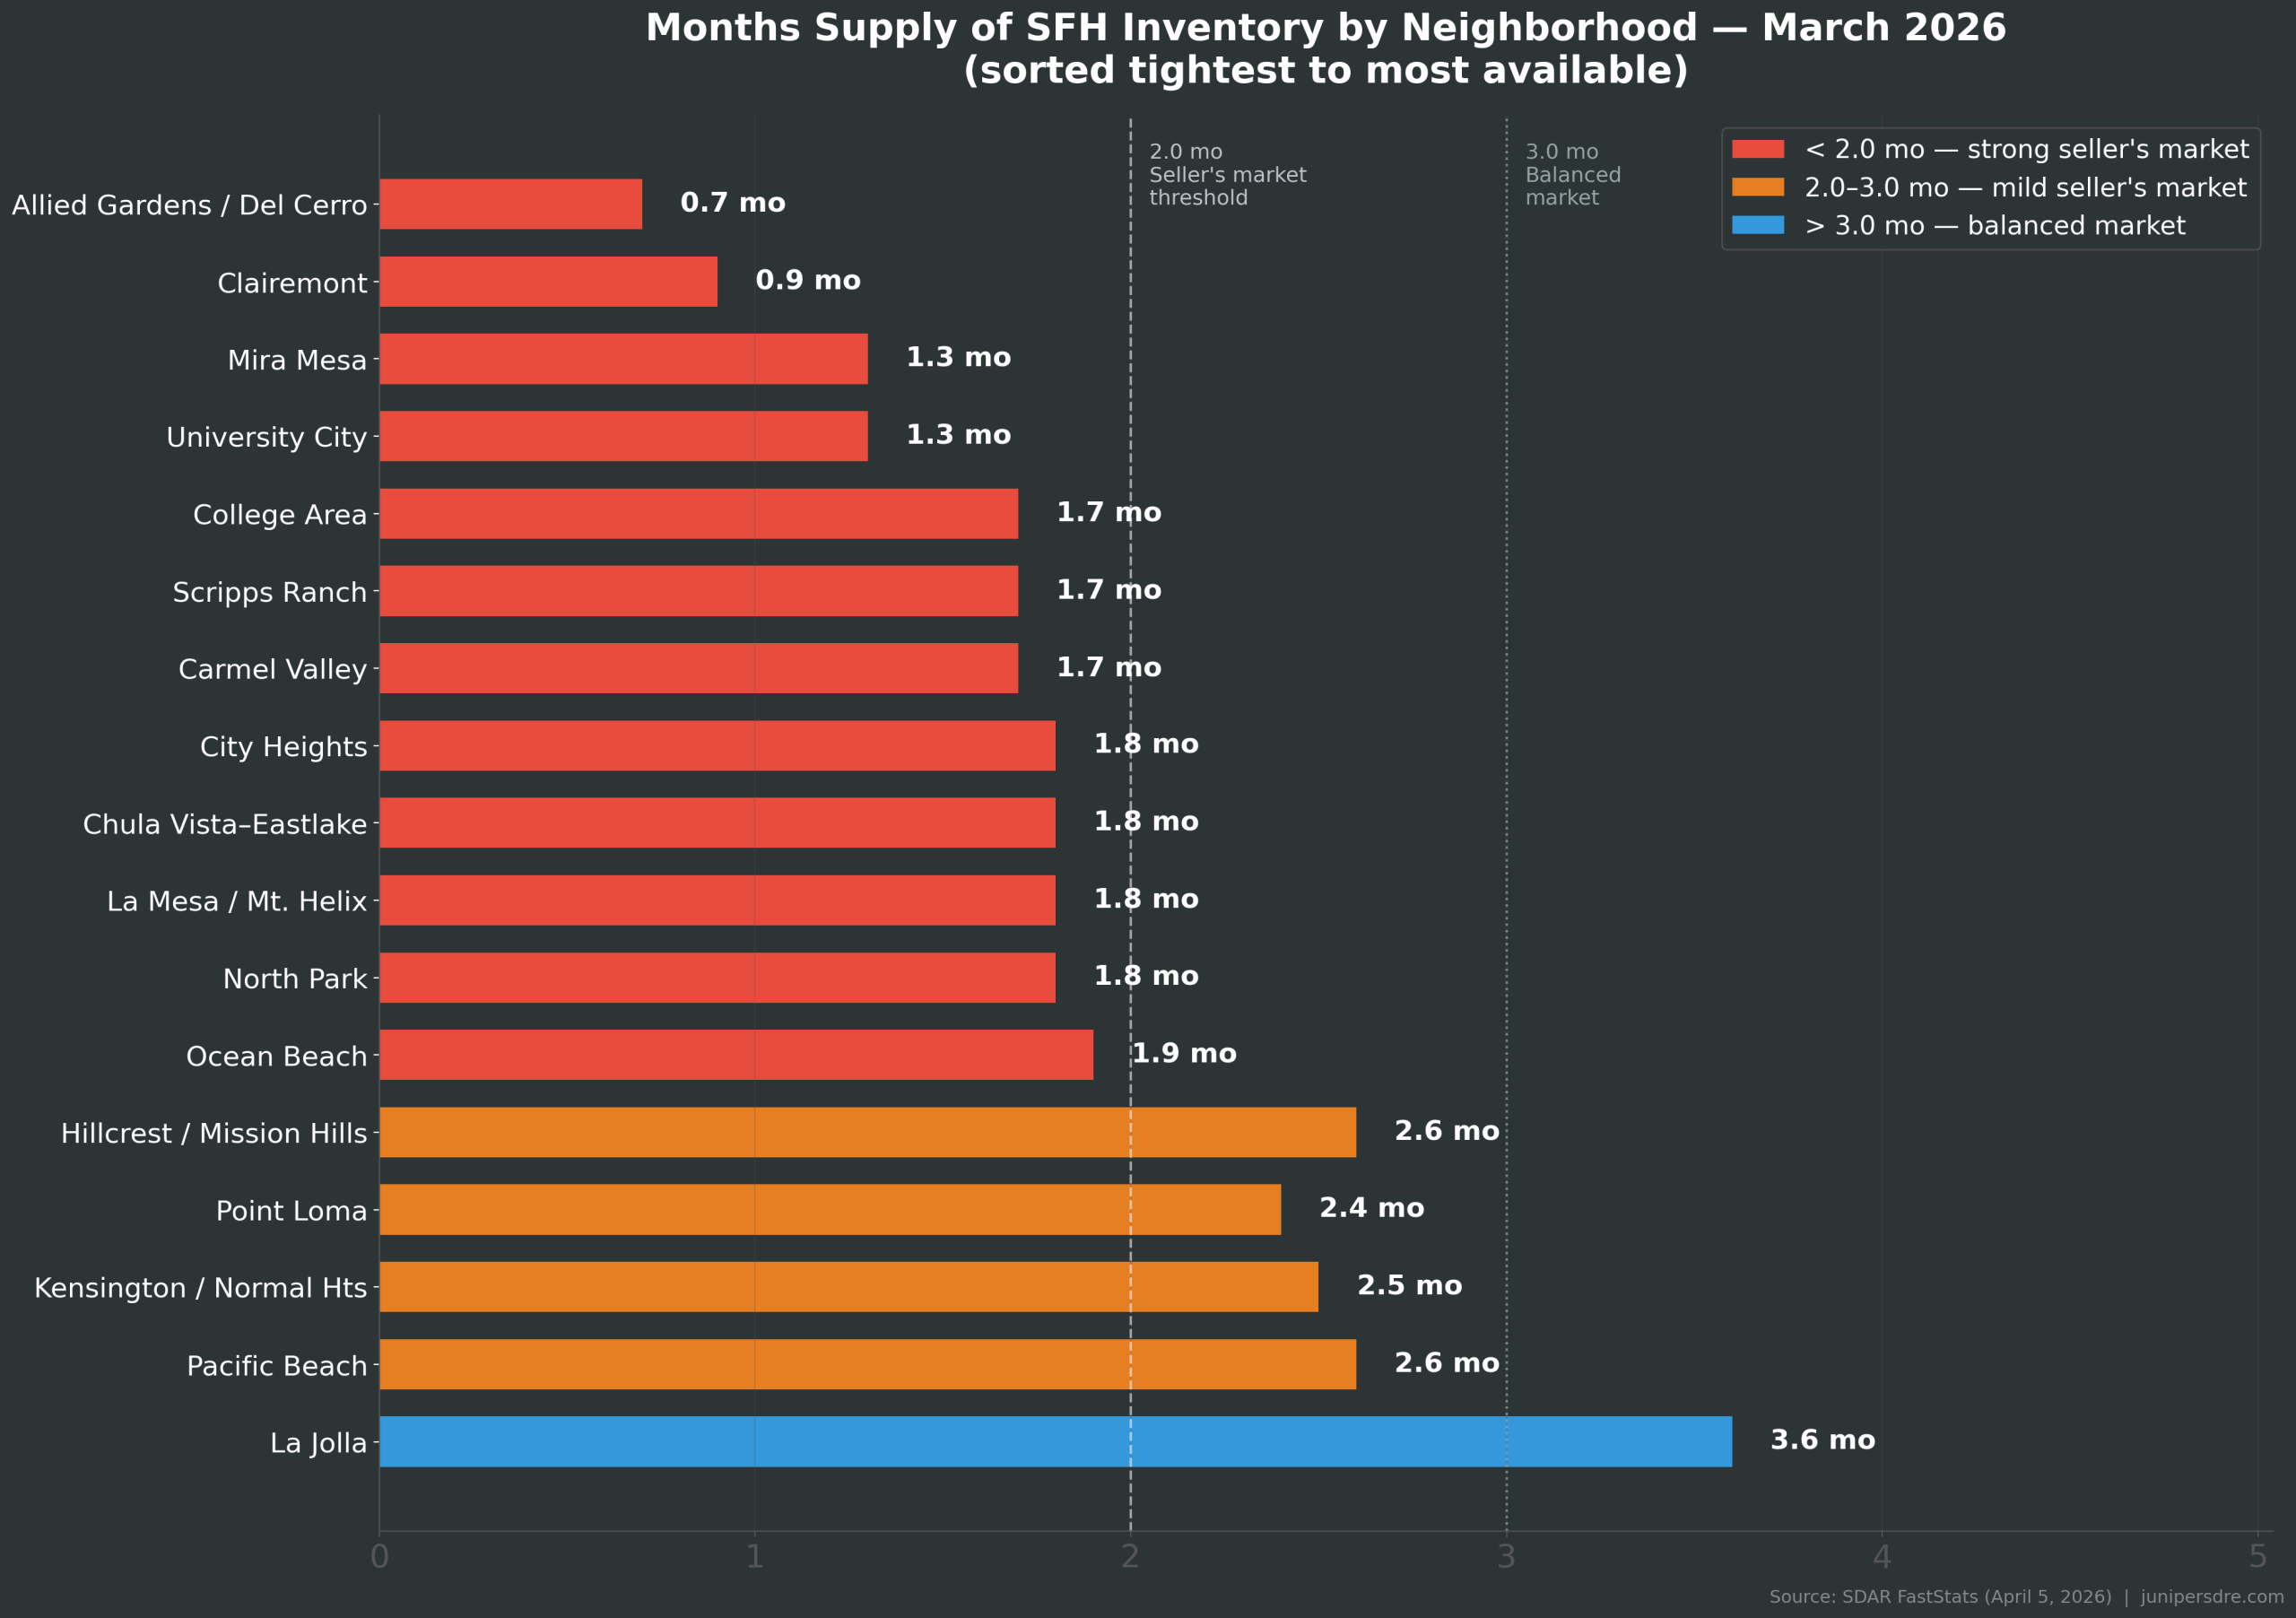
La Jolla is the only SFH market in our tracking set with more than 3.0 months of supply, sitting at 3.6. There are 83 active listings, the most of any neighborhood we cover. Buyers there have real selection and real room to negotiate. Mission Valley’s condo market is even more buyer-friendly at 5.2 months of supply, with 101 active attached listings.
La Mesa Had the Strongest Price Growth in the County
With a YTD median of $1,125,000 and a 23% year-over-year gain, La Mesa/Mt. Helix had the strongest SFH price growth of any neighborhood we track through the first quarter of 2026. That’s a big number, and it held across 60 closings, which makes it credible rather than a small-sample fluke.
Pacific Beach also posted a strong YTD figure, up 23.6% to $2,350,000, though with only 33 closings the month-to-month swings can be dramatic. Kensington/Normal Heights showed up solidly at +3.6% YTD despite a volatile single-month reading. Most other neighborhoods were flat to down slightly year-over-year, which fits a market where prices already ran hard in 2023-2024.
How San Diego Compares to the Rest of Southern California
San Diego was one of only two SoCal counties to post year-over-year price growth in February 2026, according to C.A.R. data. Orange County fell 2.3%. Los Angeles fell 1.1%. Riverside fell 2.4%. Ventura fell 4.1%. San Diego was up 1.0%, and sales volume rose 4.6% year-over-year, while most neighboring counties saw transactions decline.
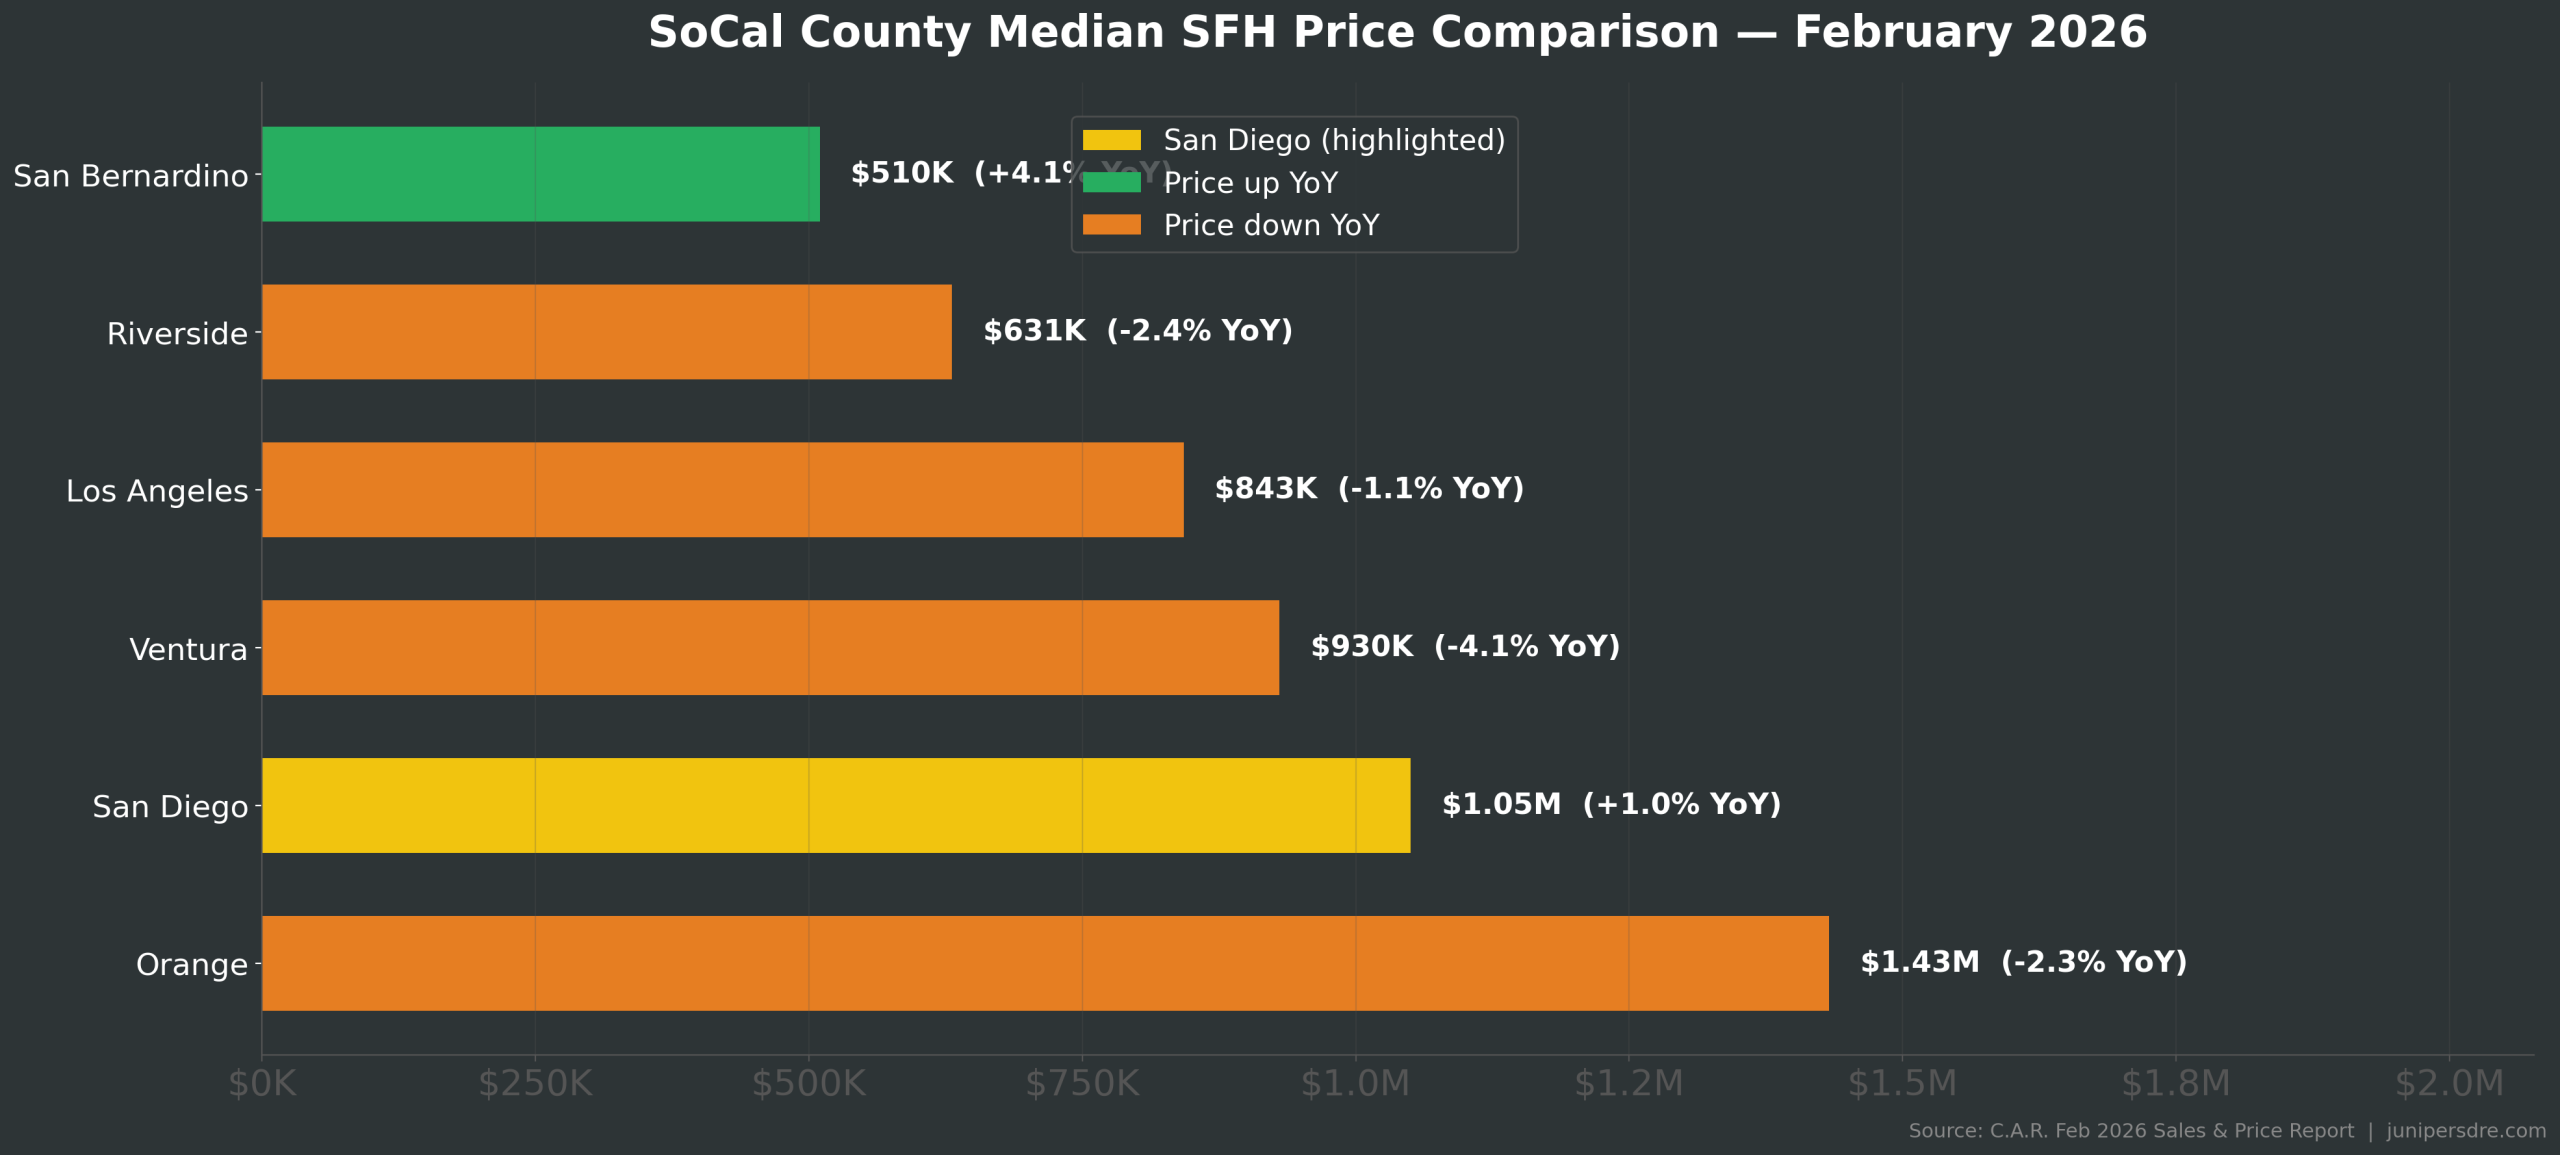
The divergence matters. San Diego’s job base, its coastal land constraints, and persistent demand from military and biotech households are doing work that the interest-rate environment alone can’t offset. That doesn’t mean prices are going up forever, but it does explain why SD has held ground when most of SoCal has softened.
Note: SoCal comparison uses C.A.R. February 2026 county data. March 2026 C.A.R. figures release approximately April 17-21, 2026.
What It Costs to Buy Here
According to the California Association of REALTORS’ Q4 2025 Housing Affordability Index (HAI), only 15% of San Diego households earn enough to qualify for a median-priced single-family home at current rates. That requires a minimum annual income of $243,600, with a monthly payment including taxes and insurance of $6,090. The national figure is 39%. Even statewide California sits at 18%.
| Metric | San Diego | California | U.S. |
|---|---|---|---|
| Housing Affordability Index (HAI) | 15 | 18 | 39 |
| Minimum qualifying income (SFH) | $243,600 | — | $101,600 |
| Monthly payment (taxes + insurance incl.) | $6,090 | — | — |
| First-time buyer HAI (entry-level homes) | 30 | 33 | 57 |
Source: C.A.R. Q4 2025 Housing Affordability Index (published February 2026). HAI = 100 means median-income household can exactly afford median-priced home. Rate used: 6.35%.
First-time buyers have a slightly better shot at the entry-level market. The first-time buyer HAI for San Diego is 30, meaning the entry-level price ($844,900) requires $160,800 per year to qualify. That’s still a high bar. For buyers working through those thresholds, the Juniper buyer roadmap covers pre-approval, down payment strategies, and how to compete in a low-inventory market.
What This Means If You’re Buying or Selling in April
For buyers
Most SFH markets across the county are under 2.0 months of supply. Clairemont is at 0.9, Allied Gardens/Del Cerro is at 0.7, Mira Mesa and University City are both at 1.3. In those neighborhoods, you’re competing against other buyers on limited options, and sellers are getting close to full ask. Coming in below list price without a strong reason isn’t going to work.
La Jolla (3.6 months) and the condo market in Mission Valley (5.2 months) are the clearest exceptions where buyers have room to negotiate. If you’re flexible on location and open to attached housing, the Mission Valley market has 101 active condo listings and less competition than most of the county.
For sellers
Sellers received 98.9% of list price on average for SFH in March, essentially unchanged from the past several months. Inventory is significantly lower than a year ago, which means less competition from other sellers. The spring season is the highest-traffic window of the year for buyer activity. Homes that are priced accurately and show well are still moving in 3-4 weeks across most neighborhoods.
Got questions about what this data means for your specific neighborhood? Miguel is happy to walk through the numbers. Reach him at 619.253.3333 or miguel(at)junipersdre(dotted)com.
Frequently Asked Questions
What is the median home price in San Diego in 2026?
The median sale price for a single-family home in San Diego County was $1,100,000 in March 2026, up 2.4% from $1,074,250 in March 2025, according to SDAR FastStats. The median for condos and townhomes was $670,000, down 1.1% year-over-year.
Which San Diego neighborhood has the lowest home prices right now?
City Heights had the lowest SFH median of any neighborhood in our tracking set at $730,000 in March 2026, based on MLS closed transactions via SDAR. The College Area was second at $970,000, and Chula Vista–Eastlake came in at $1,000,000.
How long are homes sitting on the market in San Diego?
The county-wide average for single-family homes was 37 days on market in March 2026, up from 34 days the prior year. Point Loma was the fastest at 15 days. Carmel Valley was 13 days. North Park was the slowest at 48 days, up sharply from 19 days in March 2025.
Is San Diego a buyer’s market or seller’s market in 2026?
The SFH market is a seller’s market in most of the county. Months supply of inventory for single-family homes was 2.0 in March 2026, down 23% from a year ago. Most economists consider anything under 4-6 months to favor sellers. Clairemont and Allied Gardens/Del Cerro had supply under 1.0 months. The condo market is closer to balanced, with 3.4 months supply county-wide.
How affordable is San Diego housing compared to California and the U.S.?
San Diego ranked among the least affordable markets in the country. The C.A.R. Housing Affordability Index for San Diego was 15 in Q4 2025, meaning only 15% of local households can afford the median-priced SFH. Qualifying requires a minimum annual income of $243,600 at current rates. California statewide is 18%, and the national average is 39%.
Data sourced from the Greater San Diego Association of REALTORS® (SDAR) FastStats reports, current as of April 5, 2026, and the California Association of REALTORS® February 2026 Sales & Price report and Q4 2025 Housing Affordability Index.